Beyond Latency: Engineering Comprehensive Observability for Production LLM Applications
Monitoring traditional services is one thing. LLMs introduce unique challenges. Getting a clear picture of what's happening in production with these models requires a different approach to observability.
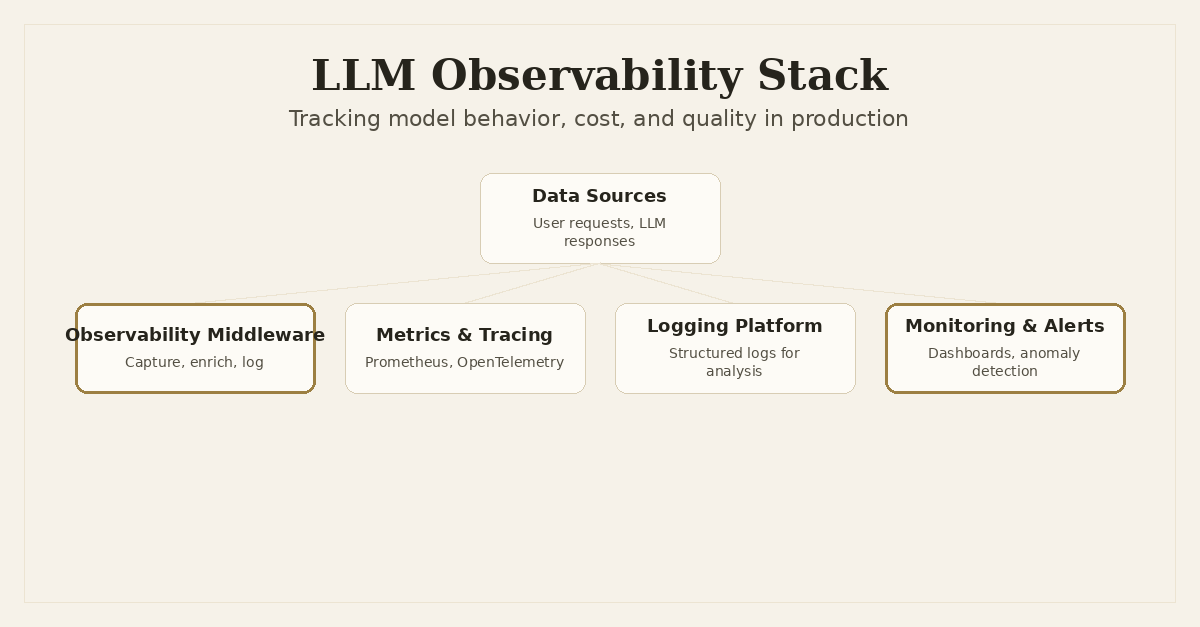
Beyond Latency: Engineering Comprehensive Observability for Production LLM Applications
Shipping an LLM-powered feature or product is just the first step. Keeping it running reliably, efficiently, and effectively in production is where the real engineering challenge begins. I've learned this firsthand while building projects like Snapfix, which streams AI-generated code fixes, and especially with Dronzer AI Gateway, which orchestrates requests across dozens of LLM providers. Traditional monitoring tools, while essential for infrastructure and service health, simply don't cut it for understanding the nuances of how large language models behave.
Why LLM Observability Isn't Just 'More Monitoring'
When we talk about observability for a standard API, we're typically looking at CPU, memory, network I/O, request latency, error rates, and perhaps database query times. These are critical. But LLMs introduce entirely new dimensions:
- Stochastic Nature: LLMs aren't deterministic. The same prompt can yield different responses, making "correctness" harder to define and monitor.
- Token Economics: Every request incurs a cost tied to token usage. This isn't just about CPU cycles; it's a direct financial metric that needs constant tracking.
- Quality Drift: Model performance can degrade over time due to changes in user input patterns, underlying model updates, or even subtle prompt variations. Detecting this drift requires specialized metrics.
- Hallucinations & Safety: LLMs can generate factual inaccuracies or unsafe content. Monitoring needs to include mechanisms to flag or quantify these issues.
- Context Window Management: How effectively is the model using its context? Are we hitting limits? Is our RAG system retrieving relevant chunks?
Ignoring these LLM-specific aspects leaves you blind to production issues that can quickly escalate into cost overruns, poor user experience, or even reputational damage. My goal with Dronzer AI Gateway, for instance, was not just to route requests, but to provide the bedrock for understanding what models were being used, how much they cost, and how well they performed for specific tasks.
The Pillars of LLM Observability
Just like traditional systems, LLM observability relies on three core pillars: logging, metrics, and tracing. But for LLMs, we need to extend what we capture and how we analyze it.
1. Structured Logging: The Raw Truth
Every interaction with an LLM should be logged. Not just the fact that a request happened, but the full context:
- Prompt: The exact input sent to the model (user message, system message, few-shot examples).
- Response: The full output received from the model.
- Model Metadata: Which model was used (e.g.,
gpt-4-turbo,claude-3-opus,llama3-8b), its version, and the provider. - Usage Data: Input tokens, output tokens, total tokens.
- Timestamps: Request start, response end, time-to-first-token (TTFT).
- User/Session ID: For correlating interactions to specific users or sessions.
- Application Context: The specific feature or use case that triggered the LLM call.
- Cost: Estimated or actual cost for that specific interaction.
Logging this data in a structured format (JSON is ideal) makes it queryable and analyzable. You can then search for all prompts containing a specific keyword, analyze responses from a particular model, or debug why a user received an unexpected output.
Here's a simplified example of how you might capture this in a FastAPI middleware:
# app/middleware/llm_logging.py

import time
import json
import logging
from starlette.middleware.base import BaseHTTPMiddleware
from starlette.requests import Request
from starlette.responses import Response
from starlette.types import ASGIApp

# Configure a logger for LLM events
llm_logger = logging.getLogger('llm_events')
llm_logger.setLevel(logging.INFO)
handler = logging.StreamHandler()
handler.setFormatter(logging.Formatter('%(message)s'))
llm_logger.addHandler(handler)

class LLMObservabilityMiddleware(BaseHTTPMiddleware):
    def __init__(self, app: ASGIApp):
        super().__init__(app)

    async def dispatch(self, request: Request, call_next):
        if request.url.path == '/v1/chat/completions': # Example LLM endpoint
            start_time = time.time()
            request_body = await request.json()
            prompt_messages = request_body.get('messages', [])
            model_id = request_body.get('model')
            user_id = request.headers.get('x-user-id', 'anonymous')

            response = await call_next(request)
            process_time = time.time() - start_time

            response_body = b''
            async for chunk in response.body_iterator:
                response_body += chunk

            response_data = json.loads(response_body.decode())

            # Extract LLM-specific usage and response data
            usage = response_data.get('usage', {})
            completion_text = response_data.get('choices', [{}])[0].get('message', {}).get('content', '')
            finish_reason = response_data.get('choices', [{}])[0].get('finish_reason')

            llm_event = {
                'event_type': 'llm_completion',
                'timestamp': time.time(),
                'request_id': request.headers.get('x-request-id'), # Use a distributed tracing ID if available
                'user_id': user_id,
                'model': model_id,
                'prompt': prompt_messages,
                'response': completion_text,
                'status_code': response.status_code,
                'latency_ms': round(process_time * 1000, 2),
                'input_tokens': usage.get('prompt_tokens'),
                'output_tokens': usage.get('completion_tokens'),
                'total_tokens': usage.get('total_tokens'),
                'finish_reason': finish_reason,
                # Add estimated cost, provider, etc. from Dronzer AI Gateway if applicable
            }
            llm_logger.info(json.dumps(llm_event))

            return Response(content=response_body, media_type=response.media_type, status_code=response.status_code)

        return await call_next(request)

# In your main FastAPI app:
# from app.middleware.llm_logging import LLMObservabilityMiddleware
# app = FastAPI()
# app.add_middleware(LLMObservabilityMiddleware)
This middleware captures the essence. In a real-world scenario, especially with a gateway like Dronzer, this logic would live within the routing and proxying layer, allowing for consistent logging across all LLM providers and models, and enriched with cost data from Dronzer's internal rate management.
2. Metrics: Quantifying Performance and Cost
Metrics are about aggregation and trends. While logs give you granular event data, metrics provide the high-level view of system health and performance over time. For LLMs, we need to track:
- Latency:
llm_request_duration_seconds_bucket: Histogram for overall request duration.llm_time_to_first_token_seconds_bucket: Histogram for TTFT (critical for streaming interfaces).- Grouped by
model,provider,endpoint,feature.
- Token Usage & Cost:
llm_input_tokens_total: Counter, grouped bymodel,provider,feature.llm_output_tokens_total: Counter, grouped as above.llm_estimated_cost_total: Counter for total cost, grouped as above.
- Error Rates:
llm_api_errors_total: Counter for errors from the LLM provider (rate limits, invalid API key, etc.).llm_parsing_errors_total: Counter for failures in parsing LLM responses.llm_timeout_errors_total: Counter for requests that timed out.
- Quality Proxies:
llm_user_feedback_positive_total,llm_user_feedback_negative_total: Counters from explicit user feedback.llm_hallucination_detected_total: Counter (if you have an automated detection system).llm_finish_reason_total: Counter for differentfinish_reasonvalues (e.g.,stop,length,content_filter).
- Context Window Utilization:
llm_context_window_used_ratio_bucket: Histogram of (input_tokens + output_tokens) / model_max_tokens.
Prometheus and Grafana are excellent for this. You instrument your code to increment counters or observe histograms, and Prometheus scrapes these metrics. Grafana then visualizes them, allowing you to build dashboards that show cost trends, model performance over time, and potential issues.
# app/metrics.py

from prometheus_client import Counter, Histogram, generate_latest

# Define Prometheus metrics
LLM_REQUEST_DURATION = Histogram(
    'llm_request_duration_seconds',
    'Duration of LLM requests in seconds',
    ['model', 'provider', 'feature']
)

LLM_TTFT_DURATION = Histogram(
    'llm_time_to_first_token_seconds',
    'Time to first token for LLM streaming responses in seconds',
    ['model', 'provider', 'feature']
)

LLM_INPUT_TOKENS = Counter(
    'llm_input_tokens_total',
    'Total input tokens processed by LLMs',
    ['model', 'provider', 'feature']
)

LLM_OUTPUT_TOKENS = Counter(
    'llm_output_tokens_total',
    'Total output tokens generated by LLMs',
    ['model', 'provider', 'feature']
)

LLM_ESTIMATED_COST = Counter(
    'llm_estimated_cost_usd_total',
    'Estimated total cost of LLM interactions in USD',
    ['model', 'provider', 'feature']
)

LLM_API_ERRORS = Counter(
    'llm_api_errors_total',
    'Total LLM API errors',
    ['model', 'provider', 'error_type', 'feature']
)

LLM_FINISH_REASONS = Counter(
    'llm_finish_reason_total',
    'Total LLM completion finish reasons',
    ['model', 'provider', 'reason', 'feature']
)

# Example usage in an LLM call function (conceptual)
async def call_llm_model(prompt: str, model: str, provider: str, feature: str):
    start_time = time.time()
    try:
        # Simulate LLM API call
        response_data = await some_llm_client.chat.completions.create(model=model, messages=[{'role': 'user', 'content': prompt}])
        end_time = time.time()

        # Extract usage and other details
        input_tokens = response_data.usage.prompt_tokens
        output_tokens = response_data.usage.completion_tokens
        finish_reason = response_data.choices[0].finish_reason

        # Update metrics
        LLM_REQUEST_DURATION.labels(model=model, provider=provider, feature=feature).observe(end_time - start_time)
        LLM_INPUT_TOKENS.labels(model=model, provider=provider, feature=feature).inc(input_tokens)
        LLM_OUTPUT_TOKENS.labels(model=model, provider=provider, feature=feature).inc(output_tokens)
        LLM_FINISH_REASONS.labels(model=model, provider=provider, reason=finish_reason, feature=feature).inc()

        # Cost calculation would typically happen in Dronzer AI Gateway based on provider rates
        estimated_cost = calculate_cost(input_tokens, output_tokens, model, provider)
        LLM_ESTIMATED_COST.labels(model=model, provider=provider, feature=feature).inc(estimated_cost)

        return response_data
    except Exception as e:
        LLM_API_ERRORS.labels(model=model, provider=provider, error_type=type(e).__name__, feature=feature).inc()
        raise

# In your FastAPI app, expose /metrics endpoint
# @app.get('/metrics')
# async def metrics():
#     return Response(content=generate_latest(), media_type=CONTENT_TYPE_LATEST)
This approach directly feeds into how Dronzer AI Gateway operates. By centralizing LLM interactions, it provides a single point for collecting these metrics, regardless of which of the 45+ providers is actually serving the request. This unified view is invaluable for cost optimization and performance comparisons across models.
3. Tracing: Following the Request Journey
Distributed tracing, often implemented with OpenTelemetry, helps you follow a single request as it flows through multiple services. For LLM applications, this means tracing not just the API calls to your backend, but also the internal calls to the LLM provider, RAG database lookups, and any agentic tool uses.
Integrating LLM calls into your tracing framework allows you to visualize where latency is introduced. Is it the RAG retrieval? The LLM inference itself? Post-processing? Frameworks like LangChain have built-in callback systems that can integrate with tracing tools, but for a more robust, production-grade approach, instrumenting directly within your LLM gateway (like Dronzer) gives you finer control.
For example, a trace could show:
User Request -> Your API Gateway -> Your Backend Service -> Dronzer AI Gateway -> OpenAI API -> Dronzer AI Gateway (post-processing) -> Your Backend Service (response parsing) -> User Response
Each step would have its duration, attributes (like model_id, prompt_hash, token_count), and error status. This level of detail is crucial for debugging complex, multi-step LLM workflows and understanding performance bottlenecks.
Addressing Unique LLM Observability Challenges
High Cardinality
Prompts are inherently high-cardinality data. If you try to label every metric with the full prompt string, your metrics system will explode. Instead:
- Hash Prompts: Log the full prompt, but use a hash of the prompt for metric labels. This allows you to track unique prompts without breaking your metrics system.
- Categorize: Group prompts by
feature,intent, ortemplate_idif you're using prompt templates. Dronzer AI Gateway can attach custom metadata to requests, which can be used for this categorization.
Data Privacy and Security
Logging sensitive user data in prompts and responses is a major concern. You need a clear strategy:
- Redaction/Masking: Implement redaction logic for PII or sensitive data before logging. This can be done at the middleware level or within the LLM gateway.
- Access Control: Strict access control to your logging and observability platforms.
- Retention Policies: Define and enforce data retention policies for logs.
- Encryption: Encrypt logs at rest and in transit.
Quality Drift and Hallucination Detection
These are hard problems, and there's no silver bullet. Approaches include:
- Human-in-the-Loop: Collect explicit user feedback (e.g., "thumbs up/down" buttons) and use it to train quality metrics.
- Golden Datasets: Periodically run your LLM against a known "golden" test set and compare outputs. Monitor the deviation.
- Output Validators: For structured outputs, use Pydantic or JSON schema validation. Log validation failures.
- Semantic Similarity: For open-ended responses, use another LLM or embedding model to score similarity against expected answers.
- Guardrails: Implement separate classification models or rule-based systems to detect and flag unsafe or hallucinated content before it reaches the user. My work on Dronzer includes mechanisms for integrating such guardrails.
Architectural Considerations for Robust LLM Monitoring
Centralized Data Collection
Whether you're using a single LLM or orchestrating across many, centralizing your observability data is non-negotiable. All logs, metrics, and traces should flow into a unified system (e.g., ELK stack, Grafana Loki, Prometheus, Jaeger).
Asynchronous Processing
Observability data collection should never block the main request path. Use asynchronous logging, metrics emission, and tracing propagation to minimize overhead. This is particularly important for high-throughput systems like Dronzer AI Gateway.
Sampling Strategies
For very high-volume applications, logging every single prompt and response might be too expensive or generate too much data. Consider intelligent sampling:
- Error-based Sampling: Always log requests that result in errors.
- Random Sampling: Log a percentage of successful requests.
- User-based Sampling: Log all requests for a specific subset of users (e.g., internal testers).
Dashboards and Alerting
Finally, the data needs to be actionable. Build dashboards that clearly display key LLM metrics:
- Cost Dashboard: Daily/weekly cost breakdown by model, provider, and feature.
- Performance Dashboard: Latency (P95, P99), TTFT, token throughput.
- Error Dashboard: API errors, parsing errors, rate limits.
- Quality Dashboard: User feedback, validation failures, hallucination flags.
Set up alerts for deviations from baselines: sudden cost spikes, increased error rates, or significant drops in user feedback. These alerts are your first line of defense against production issues.
Conclusion
Building robust, observable LLM applications requires moving beyond traditional monitoring paradigms. It demands a deliberate focus on LLM-specific metrics, careful structured logging, and thoughtful integration of tracing. Projects like Dronzer AI Gateway inherently provide a fantastic foundation for this, acting as a central nervous system for all LLM interactions, enabling comprehensive data collection and analysis.
By investing in a solid observability strategy from the outset, you're not just reacting to problems; you're proactively understanding your models' behavior, optimizing costs, and ensuring a high-quality experience for your users. It's a continuous process, but one that pays dividends in the long run, turning the opaque world of LLMs into something you can measure, manage, and master.
Frequently Asked Questions
Why is LLM observability different from traditional application monitoring?
LLMs introduce unique metrics like token usage, hallucination rates, and prompt effectiveness, which aren't covered by standard CPU/memory/latency monitoring. Understanding model behavior, cost, and quality requires specialized tracking.
What are the most critical metrics to track for production LLM applications?
Key metrics include request latency (overall, TTFT), token usage (input/output, cost), error rates (API, parsing), model quality proxies (e.g., user feedback, specific task success rates), context window utilization, and rate limit occurrences.
How can I implement structured logging for LLM interactions in a FastAPI application?
You can use FastAPI middleware to capture incoming prompts and outgoing responses, along with metadata like model ID, user ID, and timestamps. Logging this data as JSON allows for easy parsing and analysis in centralized logging systems.
What role does Dronzer AI Gateway play in LLM observability?
Dronzer AI Gateway acts as a central point for all LLM interactions, making it an ideal place to intercept, log, and emit metrics for requests flowing to various providers. This provides a unified view of LLM performance, cost, and usage across your entire application stack.
Written by Ansh Gautam
Full-stack engineer building production systems with FastAPI, React, and AI/LLM integrations. Currently looking for backend engineering & AI integration roles.